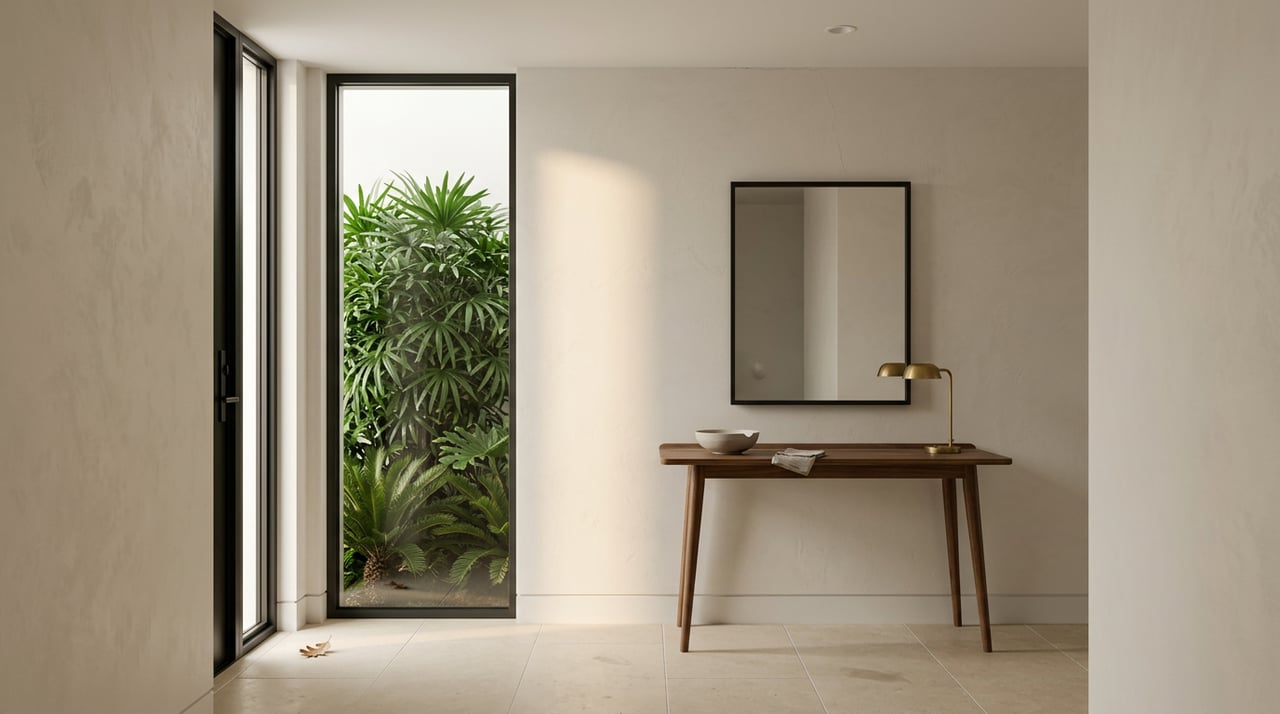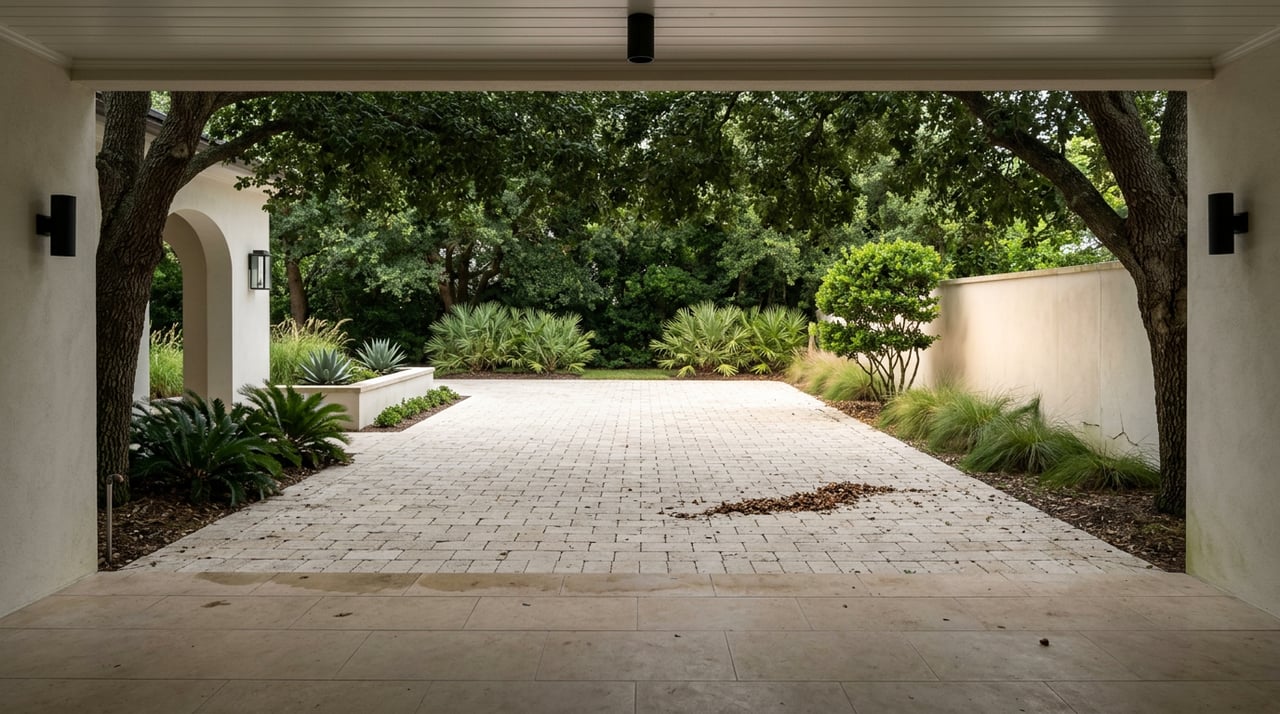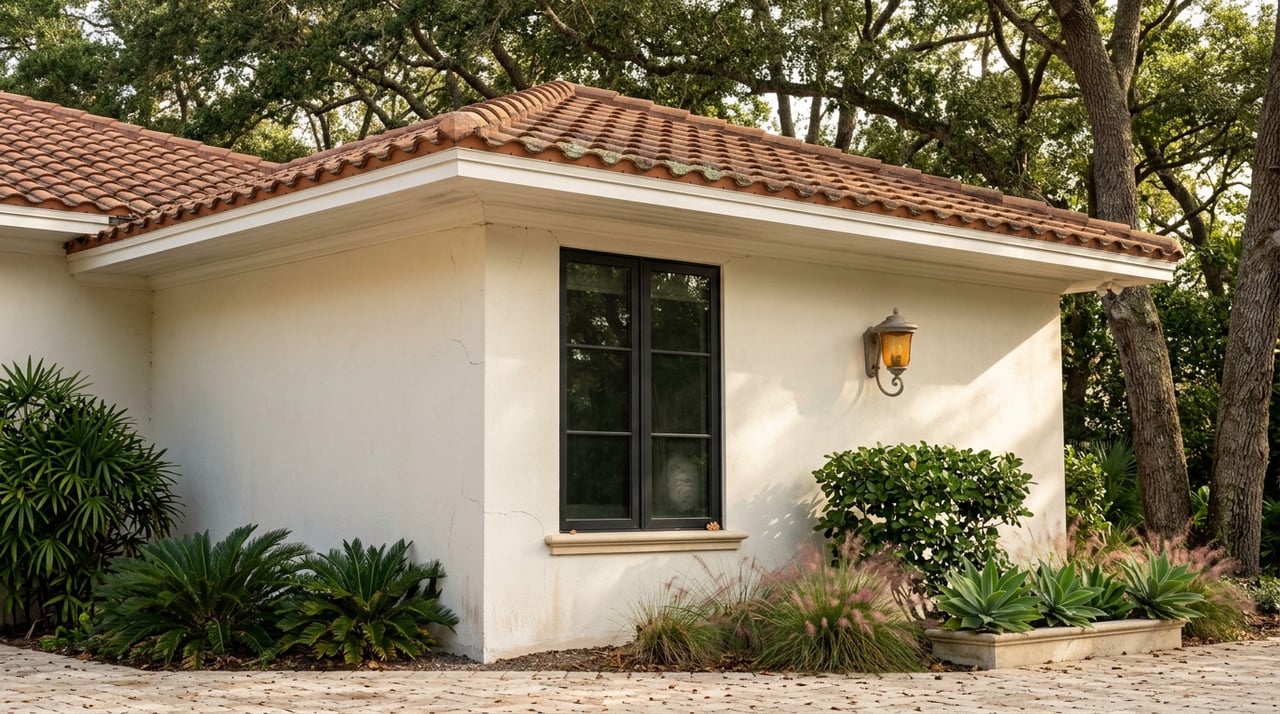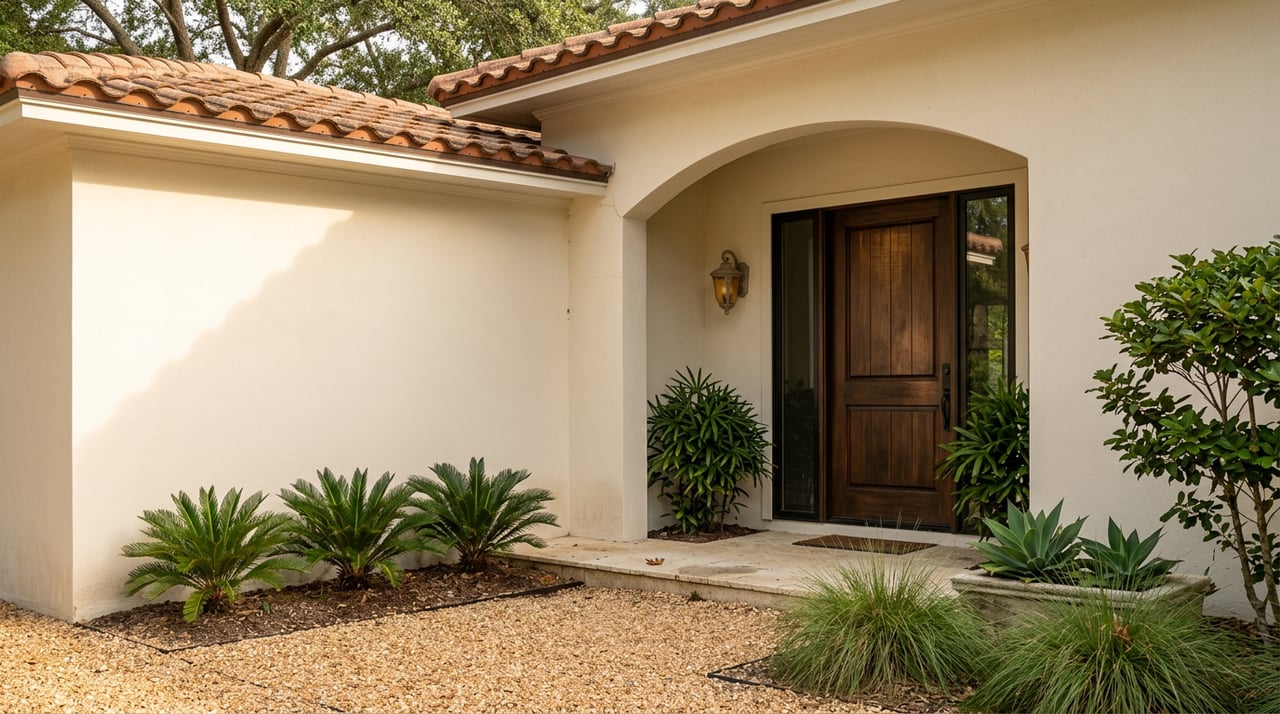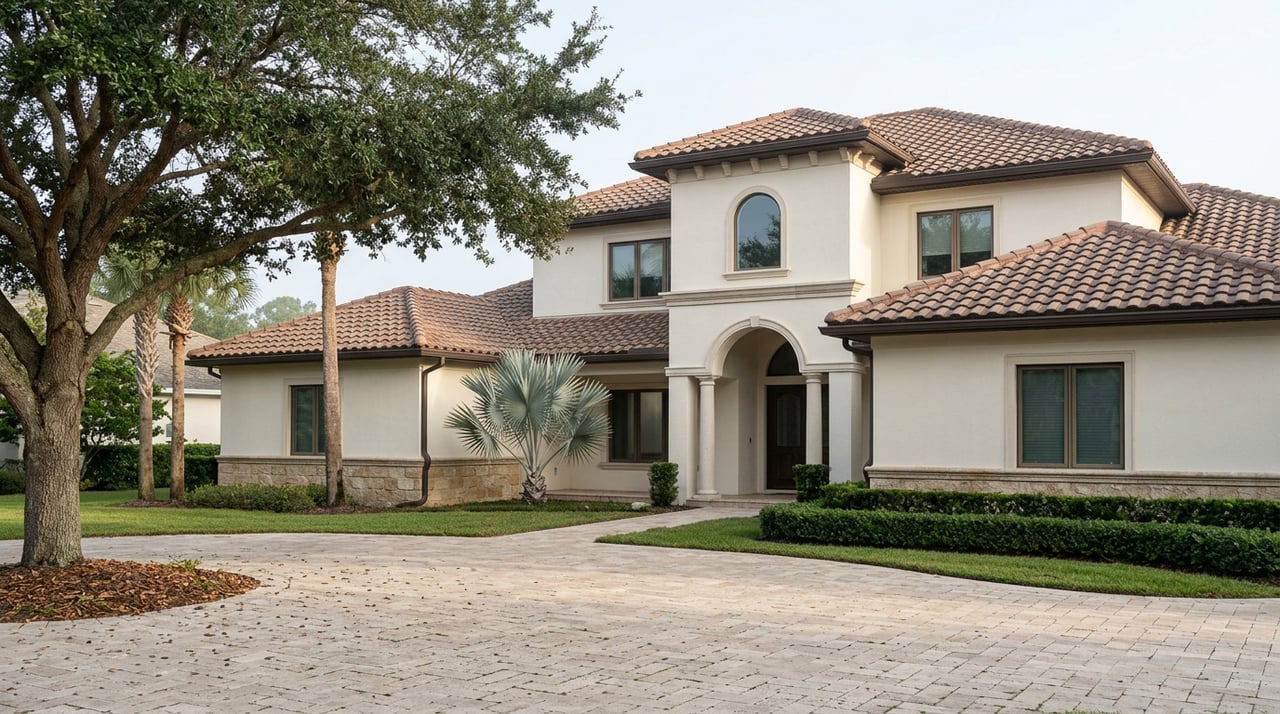
Pull up three different real estate data pages for Riomar in Vero Beach and you will get three different neighborhoods. One shows a single home changing hands in the trailing year, priced at $273,000, sold the same day it was listed. Another shows two sales averaging just under $3 million, at $932 a square foot, sitting on the market for nearly three months. A third puts the average sale price at $4.47 million, over $1,200 a square foot.
Same streets. Same golf course. Same oak canopy. Three completely different pictures of what a Riomar home costs.
This is not a case of bad data. It is what happens when a market this small gets asked to produce a statistic that markets this small were never built to produce. If you are comparing Riomar to other Vero Beach barrier island communities and leaning on a headline average to do that work, the number you are looking at is telling you less than you think.
Three Snapshots, Three Different Riomars
Here is what each source actually reported, side by side.
| Source period | Sales counted | Reported figure |
|---|---|---|
| Trailing 12 months, as of August 2026 | 1 home | $273,000 sale price, sold same day listed |
| Trailing 12 months, as of November 2025 | 2 homes | $2,985,000 average sale price, $932/sqft, 88 days on market |
| Recent transactions, undated snapshot | Unspecified | $4,474,000 average sale price, $1,246/sqft |
None of these numbers are wrong. Each one is an accurate reflection of whatever sold during that particular window. The problem is the word average implies a pattern, a typical outcome you could expect to see again. In a neighborhood where one or two homes change hands in a given year, there is no pattern. There is only whatever happened to close.
Why One Sale Can Swing the Whole Picture
Most Vero Beach neighborhoods generate enough annual sales that a median or an average smooths out the outliers. A starter cottage that sells low gets balanced by an estate that sells high, and the middle of the distribution settles into something meaningful. That only works with volume.
Riomar does not have volume. When the reporting window catches just one closing, that single transaction is the average. There is nothing to smooth it against. A $273,000 sale in a neighborhood otherwise known for multi-million dollar oceanfront estates is almost certainly a smaller interior lot, a fixer, or a property that fell well outside the profile most buyers associate with the name Riomar. But on a data page, it reads as the entire market.
Widen the window by even a few months, catch a different closing or two, and the average moves by millions. That is not volatility in the traditional sense. It is a sample size problem dressed up as a market trend.
The Boundary Nobody Draws the Same Way
There is a second layer to this, and it has nothing to do with timing. It has to do with what counts as Riomar in the first place.
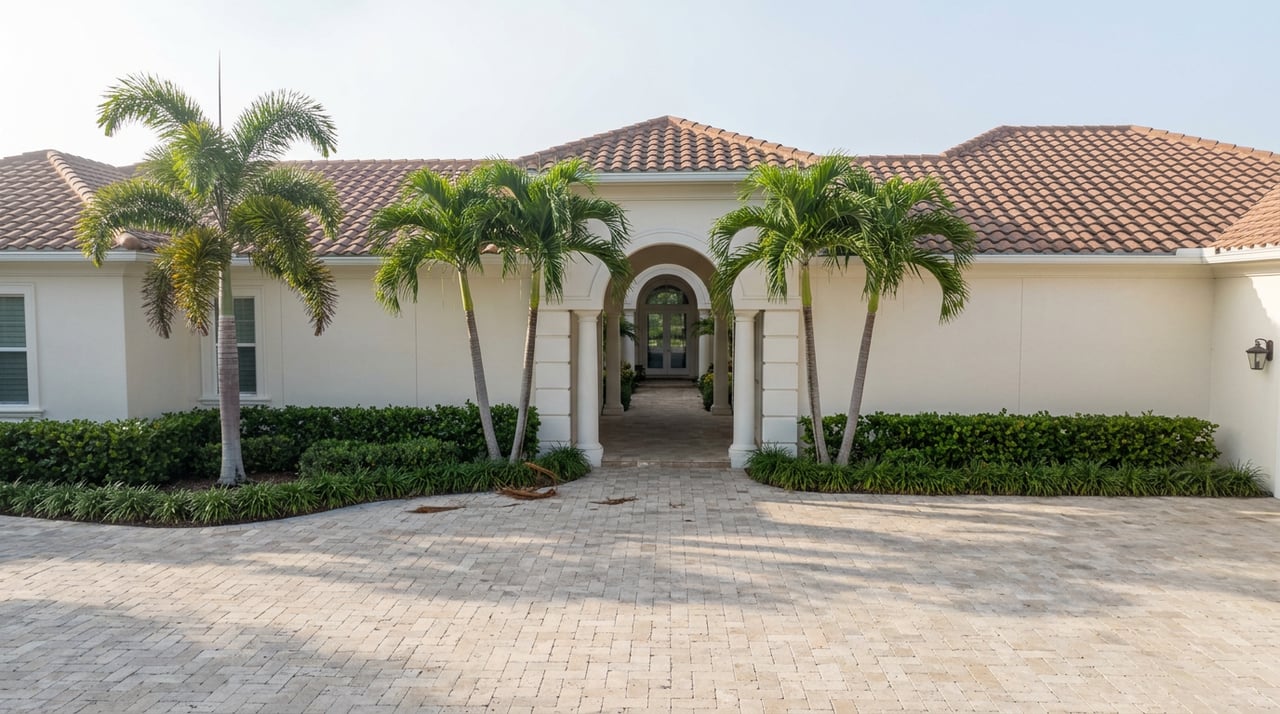
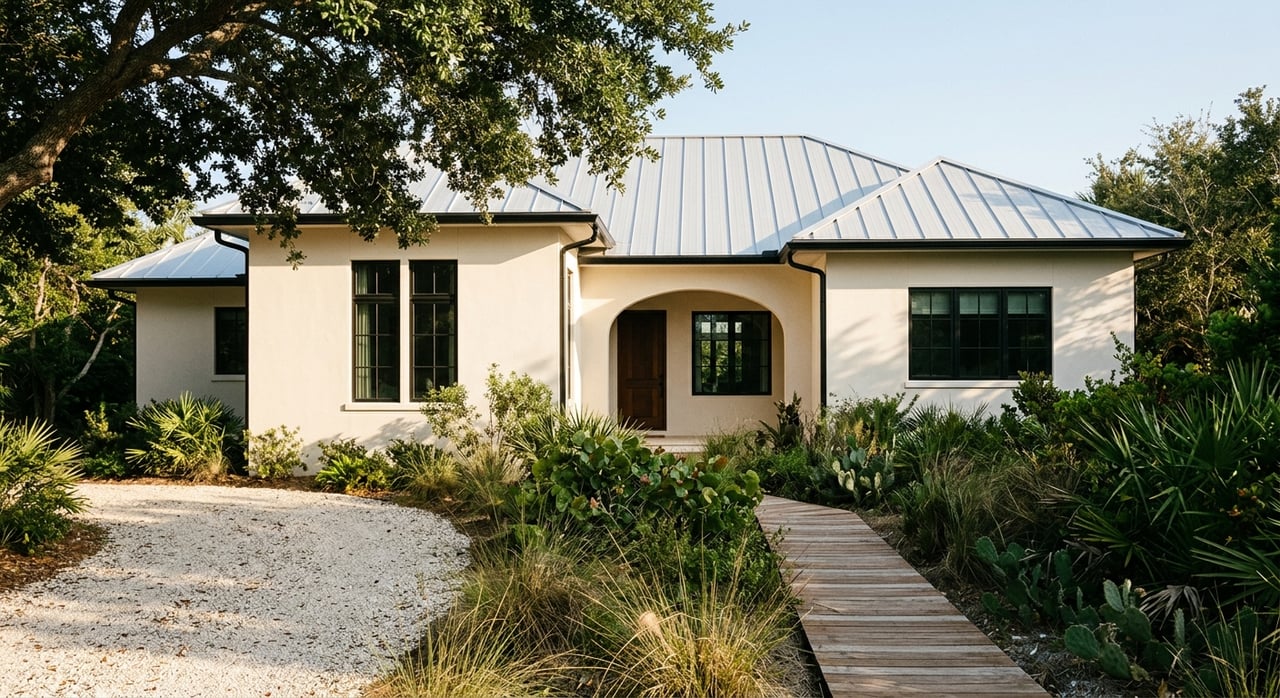
The historic core, sometimes called old Riomar, is the non-gated original section built alongside Riomar Country Club, with homes on oak-lined streets facing the golf course, the ocean, or the interior. Around it sit three additional subdivisions that some listing platforms fold into the same neighborhood label: Riomar Bay, Riomar Bay II, and Riomar Cove. These are real, distinct sections with their own character, but they are not architecturally or historically identical to the original golf-course core, and they do not always command the same price per square foot.
Depending on which platform you are looking at, and how that platform draws its neighborhood boundaries, a "Riomar" statistic might include only the historic section, or it might blend in homes from all four areas. Add to that a genuine range in the housing stock itself. Properties in the area date from as early as 1953 through 2009, and sizes run from roughly 1,000-square-foot cottages up to 14,000-square-foot oceanfront estates. A single average sitting on top of that much variation is describing a spread, not a typical home.
What the Active Listings Actually Show You
If the closed-sale average is unreliable at this volume, the more honest signal is what is actively on the market right now, because you can see the full spread rather than a single point estimate.
As of this writing, one Riomar listing sits at 975 Riomar Drive, priced at $8.5 million. Another, at 920 Greenway Lane, is listed at $3.85 million for a 4,684-square-foot home with six bedrooms and five bathrooms. That is a more than two-to-one spread between two homes carrying the same neighborhood name, both currently for sale, both real data points you can verify today rather than reconstruct from a handful of closings months apart.
The 88-day average time on market reported for the two-sale window in late 2025, alongside a 92 percent list-to-sale ratio, is arguably more useful than either the $273,000 outlier or the $4.47 million average. It tells you that when a well-positioned Riomar home does trade, sellers are getting most of their ask, but buyers are getting real negotiating room over a stretch of nearly three months. That is a behavior pattern, not a coin flip.
The Club Is a Separate Ledger
One more piece worth understanding before you compare Riomar to anywhere else on the island. Riomar Country Club was built in 1919, making it the oldest golf course in Vero Beach and the only one directly on the ocean, with seven of its first nine holes running along the Atlantic. Access to the club is not bundled into a home purchase the way a subdivision amenity fee might be. Membership is its own application and its own cost structure, separate from whatever a house itself sells for.
That distinction matters when you are sizing up what a Riomar address actually requires financially. The home price you see, however unreliable at this sample size, is only part of the total picture for a buyer who wants full use of the neighborhood's signature amenity.
What This Means If You Are Comparing Neighborhoods
None of this means Riomar is unaffordable or that the numbers are meaningless as raw data. It means the number needs context before it is useful for comparison. If you are cross-shopping Riomar against The Moorings, Central Beach, or Castaway Cove, ask what window the figure covers, how many sales it is built on, and whether the source is counting the historic core alone or blending in the surrounding subdivisions. A median built on two sales deserves a different level of trust than one built on twenty.
For a market this thin, the more reliable exercise is looking at what is actively listed, how long comparable homes have taken to sell, and how close asking prices have landed to final sale prices. Those figures hold up under scrutiny in a way a single averaged number cannot.
A Short FAQ
Does a low reported average mean Riomar is more affordable than it looks? Not necessarily. A low average in a thin market is often the result of one atypical sale, not a shift in what similar homes are commanding. Check what specific property drove the number before drawing a conclusion.
Should I trust price per square foot more than the average sale price? It is a better metric but still needs volume to be reliable. With only one or two sales in a given window, price per square foot swings for the same reason the average does. Treat it as one data point, not a settled figure.
Is Riomar Bay the same market as historic Riomar? They share proximity and the Riomar name, but they are distinct subdivisions with different histories and housing stock. When comparing prices, confirm which section a statistic is actually describing.
If you are trying to make sense of what a specific Riomar address is really worth, or how it stacks up against another barrier island community, that is exactly the kind of read a headline number cannot give you. Danielle M. Reidy can walk through the actual comparable sales, the current active spread, and what it would take to make a move here work for your plans. Request a Free Market Analysis to start with real numbers instead of a portal average.